South Africa has had one of the most brutal lockdowns in the world, according to the UN. Its regulations have also been some of the most restrictive. The rationale was to curb the spread of the virus that causes Covid-19. But now that the country has moved down to a level 4 lockdown, the question is, what did our harsh restrictions do to slow Covid-19?
To answer this kind of question, a Harvard professor of strategy, a mathematics professor at the Hebrew University of Jerusalem, and a data research guru have devised ‘A simple score to tell if we are beating the virus‘.
The thing to know is ‘the effective reproductive number’, denoted in scientific literature by ‘Re’. This is different from ‘R0’, which is more widely discussed, since R0 is the number of people you would likely infect if you had the virus and no one else did. Re should account for additional factors like herd immunity.
But calculating Re is a highly technical exercise requiring the input of many variables that are currently unclear. That is why the authors mentioned above devised ‘R’, a simple approximation of ‘Re’, being the number of people each vector has, on average, infected on a rolling daily basis.
The formula really is simple. Take the number of newly confirmed cases on the most recent date and divide them by the number of new cases four days earlier to find R. If R is above 1 that suggests the virus is spreading exponentially. If R = 1, then the replacement rate equals the existing rate and the ‘curve has been flattened’. If R is below 1 then the number of total cases will decline over time.
Active contact
Four days is the recommended distance between the numerator and denominator in this approximation on the assumption that this is roughly the mean period during which infected persons remain in active contact, spreading the virus. Note that, if a longer period is used, the value of R will tend to swell upwards if infections are already above 1, so the approximate R value in the graphs that follow should be considered on the low end of the actual infection rate.
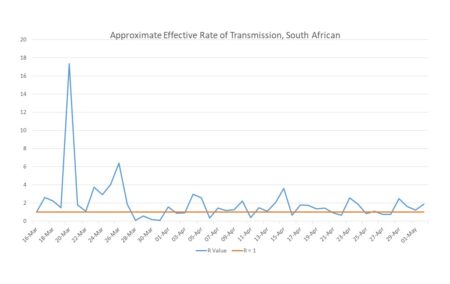
Using data collated on DataStudio, following the proposed R formula, the following graph is generated.
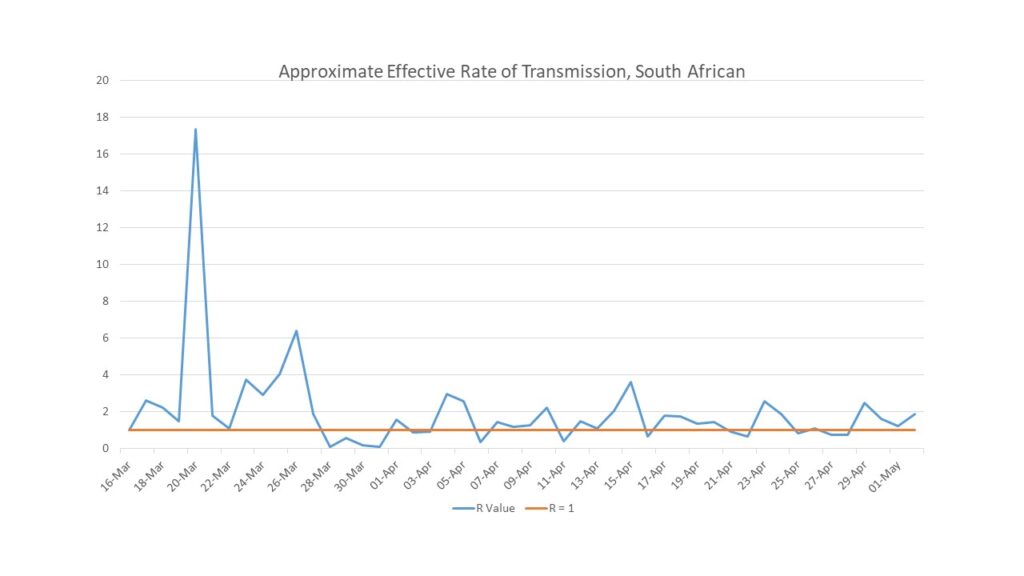
During the six-week lockdown, South Africa’s R value dropped below 1 on seven separate occasions. This might suggest that the lockdown effectively curbed Covid-19 transmission.
However, R subsequently lifted above 1 on each occasion almost immediately. Was the rate of infection changing rapidly up and down, day to day? Most likely not.
The R formula only works in the straightforward way if the number of tests conducted per day is relatively consistent, as is the case in countries with quality test operations.
Highly erratic
In South Africa the tests are highly erratic.
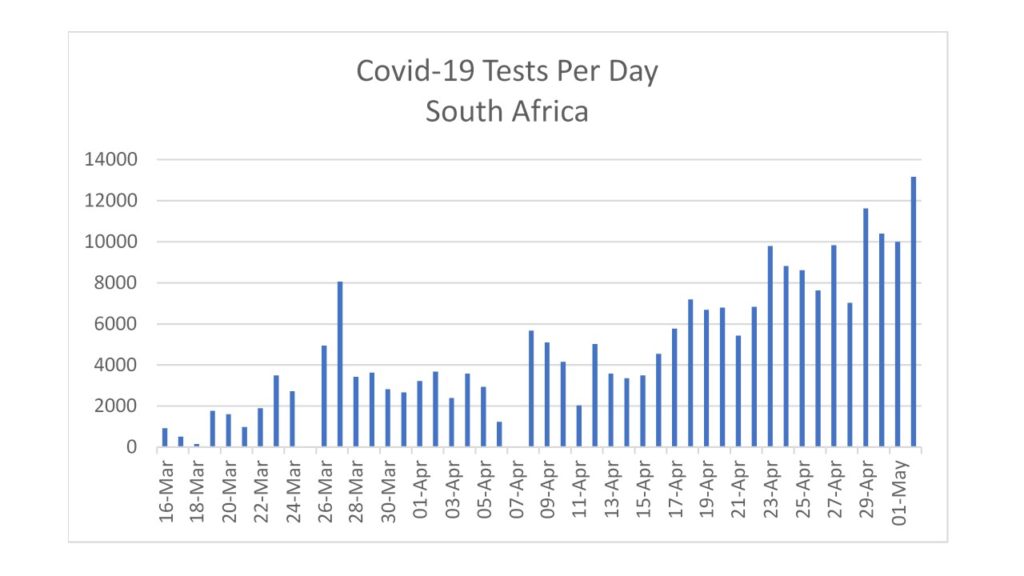
There have been cynical boasts on days with particularly high testing numbers, while on low-test days, weekly averages are emphasized by politicians in charge. It is also worth noting reports that testing capacity far exceeds the actual number of tests done. Why South Africa’s testing is so erratic, and so much lower than promised, remains an open question.
What is clear from the data is that the increase and drop in R values tracks the spikes and drops in daily testing, creating the impression on some days that we’ve curbed the virus even if we have not.
At this point, the logic tree branches. It may be that testing is so erratic in South Africa that we have no way of knowing R with any confidence at all. Alternatively, the numbers tell us something less precise, and with less confidence, when they are aggregated rather than looking at each day in isolation.
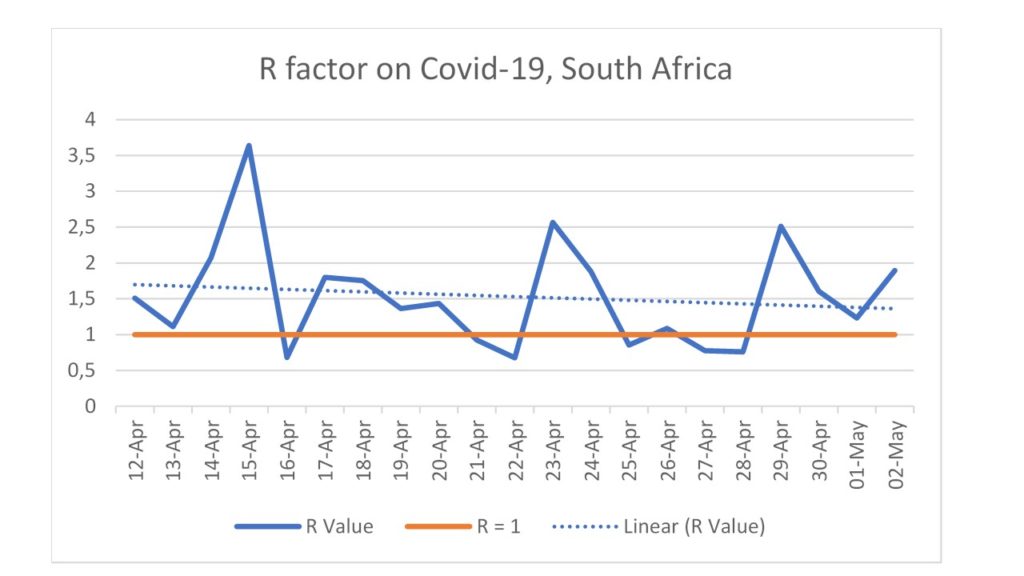
Zooming in on the last 18 days of the ‘level 5’ lockdown, the harsh indication stands out that the trend, smoothing out erratic testing rates, is an R value significantly above 1. That indicates that exponential growth of the virus persists. The same finding holds if the R trendline is established using available data throughout the lockdown dating back to 16 March.
In countries that have eased lockdowns, or are considering doing so, the R value has been touted as the deciding factor. If the infection rate has been depressed to the point where overall cases are shrinking, then, the thinking goes, it is possible to reopen the economy if only for a time, after which a lockdown can be reinstituted if the virus flares up again.
Too irregular
No such claim can be made in South Africa, although it is the basis of our ‘risk-adjusted strategic approach’. Our data is either too irregular to conclude anything about infection rates, or it indicates that the virus has continued to increase its rate of spread throughout the lockdown.
Does that mean relaxing the lockdown at the start of May was the wrong move? Almost certainly not.
Unlike in other countries, the reason relaxing the lockdown is a good idea is not because it was a success, but precisely because it was doomed to be a failure from the start. So procrustean were the regulations, and so brutal the implementation, that our lockdown did lethal, predictable and gratuitous damage to the economy, lives and liberties, while drastically compromising the nation’s food security.
That is why the lockdown needed to be relaxed, and that is why it needs to be relaxed further. We lack the administrative capacity to run a clean lockdown, or the financial resources to keep millions alive in the absence of work, though the government’s ‘Command Team’ lacks the frank self-reflection to realise it yet.
If you like what you have just read, subscribe to the Daily Friend