
President Cyril Ramaphosa is billed to address the nation next week to talk about Covid-19. The Cabinet is concerned, according to Minister in the Presidency Jackson Mthembu, ‘that some people are behaving recklessly and irresponsibly as if Covid-19 no longer exists’’.
The data would provide answers, but some official data has bizarrely gone missing.
Most of Europe, outside of Sweden, is experiencing a second wave of Covid-19 infections, hospitalisations, and deaths. So, major European countries are reimposing lockdowns, while Denmark is culling minks. Is South Africa also entering a second wave, and should we expect a return to lockdown?
One place to look for an answer to this question is in the ‘Daily surveillance in selected hospitals’ reports from the National Institute for Communicable Diseases (NICD), which have been uploaded daily since May. This should provide a reliable guide to how many people are hospitalised, ventilated, and in ICU from Covid-19.
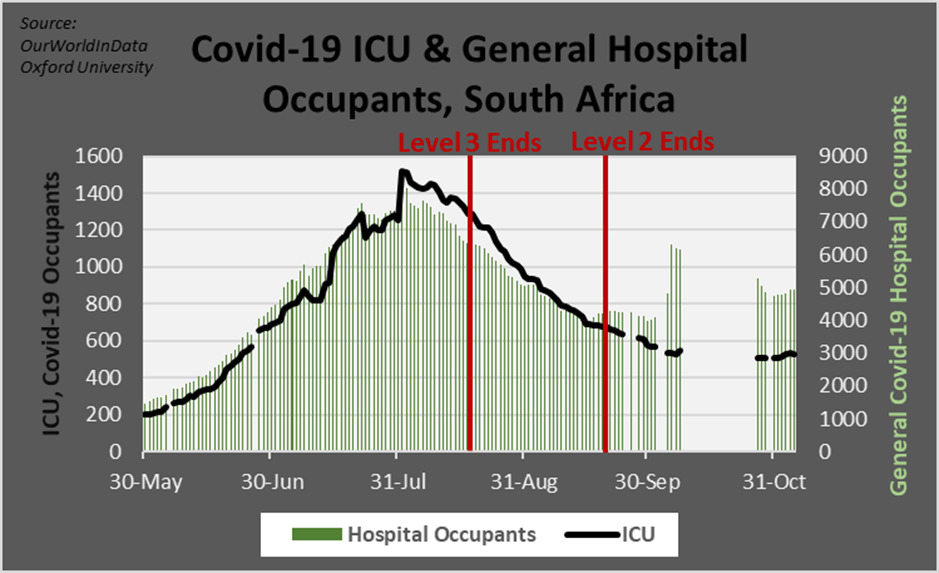
The first thing to notice in the graph above of general and ICU Covid-19 hospital admissions is what happened after ‘Level 3’ lockdown ended in August. Health Minister Dr Zweli Mkhize predicted that there would be an increase in viral contagion, ‘a second wave’, and stress on hospitals as lockdown lifted.
A second wave in early September is exactly what one would have expected had lockdown Level 3 been doing anything to keep the virus at bay until then. But this did not happen. ICU and general admissions continued to decline.
There seems to be a different story after ‘Level 2’ lockdown was lifted on 21 September. At just the point when one would have expected a ‘surge’, there was one. In the first week of October, Covid-19 hospital occupancy spiked, from 3 979 on 30 September to 6 323 by 6 October. Does this show Level 2 lockdown was partly effective?
Read naively, NICD data indicates 2 344 new hospital admissions in just six days shortly after Level 2 was lifted, by far the worst surge in South Africa in 2020. This would vindicate the National Coronavirus Command Council’s claims that ‘lockdown worked’; a week after we entered Level 1, hospitals were being flooded by thousands of new occupants.
But can you remember the great hospital surge of early October? If not, there is probably a good reason. It did not really happen in the way the graph above suggests.
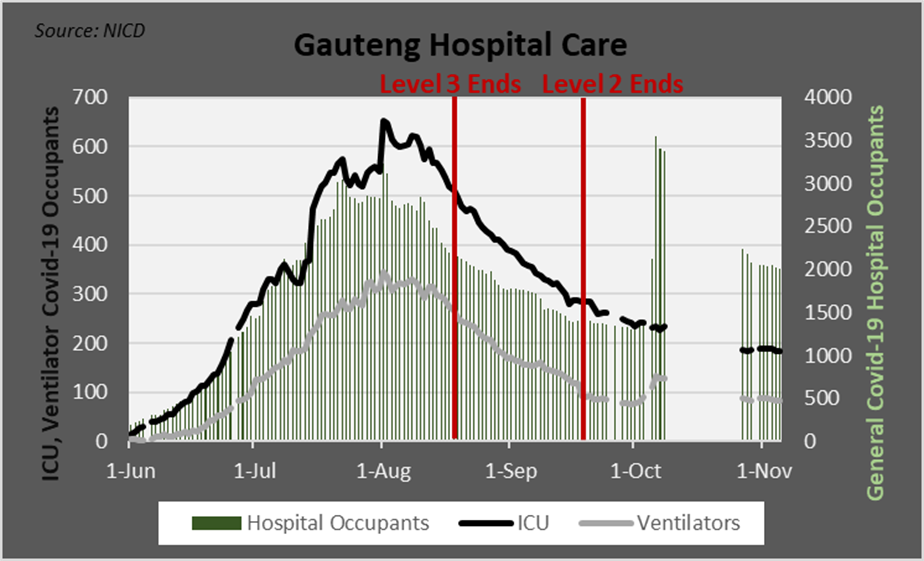
In Gauteng, NICD data show ICU, ventilator and general hospital occupancy for Covid-19 going down since early August, remaining low to date. But general hospital admissions spiked drastically, from 1 302 on 30 September to 3 553 on 6 October. This is the ‘second wave’ surge, accounting for 90% of the national increase in the first graph at the top of this piece.
But this ‘surge’ is more of an accounting issue than a reflection of reality.
Hospitals are supposed to come online in the NICD ‘select hospitals’ primarily when they go from having no Covid-19 patients to having significant numbers, which they then report. But what happened in Gauteng is that the number of public hospitals surveyed went from 6 to 38 in the week leading to 6 October, with hospitals that already had cases suddenly coming online.
This is the source of almost all the newly recorded hospital occupants. In short, the previous ‘second wave’ is long forgotten because it never really happened, it was just an accounting error.
Even more worrying is the huge gap of missing daily reports from 9 October to 27 October. I reached out to the NICD by phone and by email on 2 November to ask for an explanation. My email was acknowledged on 3 November, promising an answer soon.
As of close of business yesterday, no answer was forthcoming from the NICD. At this stage, it appears that the NICD communication department does not know what happened in hospitals on a daily basis for most of October or even why it does not know. [Editor’s note: NICD Senior Communications Manager Sinenhlanhla Jimoh has subsequently responded to say the problem was that their website was being ‘improved’. The daily data originally requested is still not available on the NICD website, nor by email, though weekly data have been shared by NICD]
So maybe we must look elsewhere to see if there is a second wave afoot. The first place to look would be in testing numbers.
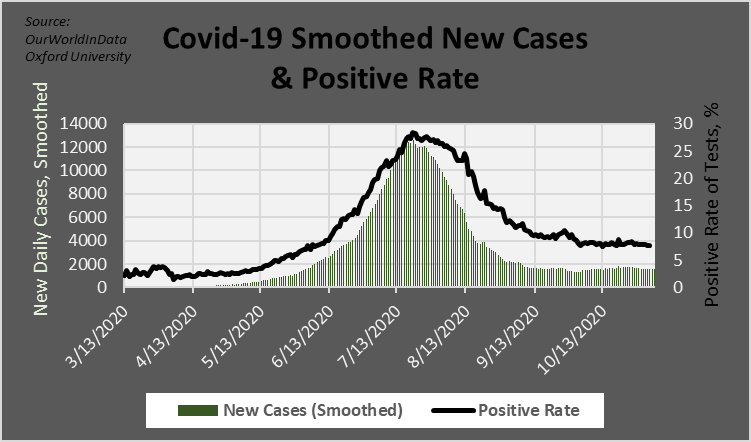
Because not all new infections are tested, it is also important to look at the ‘positive rate’, the proportion of tests that come out positive. If the number of confirmed cases stays flat but the positive rate goes up, that strongly suggests increased viral spread. But if both stay flat then it is most likely that the virus is not spreading at an accelerating rate.
The graph above shows that Covid-19 is flatlining, not surging. In the last week, the average number of new cases was just above 1 500 per day; in the week before, it was above 1 600 per day; and in the week before that it was above 1 700 per day.
Meanwhile, the positive rate has slightly declined from above 8% to 7.6%. So there is no evidence of a surge in case numbers either.
The final place to look is in confirmed Covid-19 death numbers. This is a lagging indicator, with an estimated 17-day median delay between infection and mortality so that deaths today tell us about infections weeks ago. But death numbers are worth looking at to see if they contradict or coincide with what hospital and case numbers indicate.
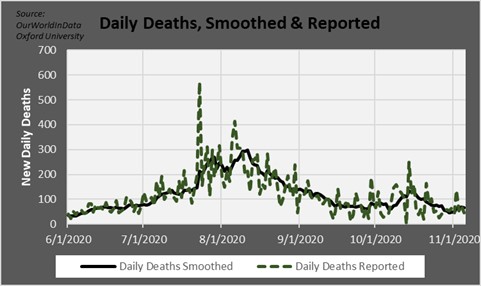
As you can see from the graph above, the number of reported deaths on any given day can vary wildly. Partly, this is because of random distributions of (statistically) small numbers, but also partly because the date when the death is reported is not always the date of actual death. Huge spikes – as happened in late July – are a result of this and are deeply misleading.
Nevertheless, the headlines will focus on a high death number on a particular day, suggesting this indicates a genuine trend.
The smoothed death numbers are more reliable for inferring trends, and they show that while there was an increase in mid-October, November’s death numbers are much lower. In mid-October, the smoothed peak was over 130 daily deaths; in November it is below 70, a nearly 50% drop.
In short, death numbers, case numbers, and hospital numbers all indicate that Covid-19 is not spreading at an accelerating rate on a national scale. This did not stop Minister Mthembu from berating the country for acting ‘as if Covid-19 no longer exists’ and may not stop President Ramaphosa from berating us too in his national address.
In fact, the National Coronavirus Command Council, not the public, has been playing charades and make-believe by acting ‘as if’ lockdown worked in the face of contradictory evidence.
Unfortunately, it appears the NICD communication team, which had been producing high quality data daily until Level 1, has joined in the game by acting ‘as if’ the public did not deserve to know on an ongoing basis without delay what happened in hospitals for most of October.
If you like what you have just read, support the Daily Friend